The Pennsylvania State Climatologist is a service to the Commonwealth by the College of Earth and Mineral Sciences and Penn State.
FROST
(Frost, Rain, Optics, Snow and Thunder)
Training Manual
Overview of Program
Gathering and Training of Volunteers
Instruments Needed
Rain Gauge Suppliers
Content of Weather Observations
Daily Rain
Intense Rain
Number of Thunder Claps
Daily Snow
Frost
Snowflake Shape
Optical Effects
Reporting of Data
Software
Frost Data Available Online
Overview of Program
The FROST program will consist of a network of volunteers in Pennsylvania who report daily precipitation and significant weather events. Volunteer opportunities will be open to all Pennsylvania residents interested in meteorology. Participants will take daily observations (when possible) of rain measurements, snow measurements, and additional weather phenomena. These observations will then be reported to us at the Pennsylvania Climatologist Office through a user-friendly web entry form. We will try to obtain as many participants as possible, especially in locations where observational data tends to be sparse. The purpose of the program is twofold. One, the observational data will be used for analysis by the climate office. Two, participants will learn about fieldwork, data collection, weather instrumentation, and meteorology in general.Gathering and Training of Volunteers
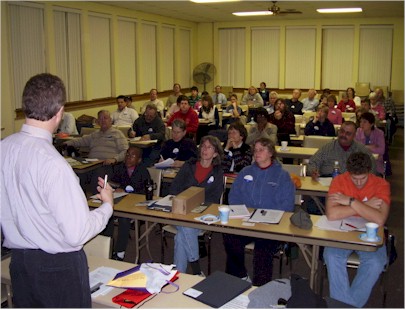
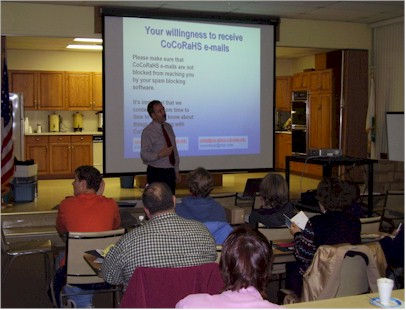
We will contact Pennsylvania volunteers through promotions on the PA Climate website to gauge interest in our program. For those that wish to participate, we will direct them to the CoCoRaHS website that will list reporting and data entry procedures. The instructions will include how to set up the equipment, how to use the equipment, and how to enter observations on the web page. For example, the site will show mounting and measurement procedures for a rain gauge. In addition to the on-line instructions, we may set up periodic training courses in specified locations through out the state. This would allow volunteers to see first hand how to use observational equipment. For teachers and students who wish to participate, we will provide some suggested exercises to make the students think critically about the data they are collecting.Instruments Needed
*Clear plastic high capacity rain gauge with mounting bracket*Clear plastic high capacity rain gauge with inner measuring cylinder and funnel removed (for snow)
*Ruler or yardstick
*Snowboard
*Flat object such as a book or board
*Warm water for cold weather
Rain Gauge Suppliers
If you need to purchase a rain gauge, we recommend the following suppliers:Scientific Sales, Inc.
Model 6330 Plastic Rain Gauge-$35.00 (Free Shipping)
Sporty's Tool Shop
Professional Rain Gauge ID# 2652T-$29.95 (Shipping approximately $10.00)
Wind and Weather
Professional Rain Gauge SKU# RG6608-$35.95 (Shipping approximately $10.00)
Content of Weather Observations
Recorded observations will be divided into the following categories: Daily Rain, Intense Rain, Number of Thunder Claps, Daily Snow, Snowflake Shape, Optical Effects. Each category will have a separate web form for the user to enter data.Daily Rain
Rain amounts would be collected from the rain gauge once a day and entered into the form. Ideally, rain would be collected at 7 AM each morning. However, if this is not possible, the time of collection can be entered on the web form. In addition to the daily quantity of rain, users can enter additional information if they have it available. This includes information such as current flooding conditions and whether visibility was reduced during the periods of rain.Intense Rain
This form would be used if a period of intense or heavy rain has fallen or is currently falling. Entered information would include the time the rain started, the amount that has accumulated, visibility observations, and any flooding information that is available.Number of Thunder Claps
This form would be used during a period when thunder is audible. For each clap of thunder that is heard, the date and time would be recorded. One clap of thunder would be defined as the initial "boom" plus the series of rumbles that often immediately follows the "boom". If there are more than 5 seconds of silence between two sets of rumbles or claps, they would be counted as two separate events. More detailed information for this topic is available on the training page.Frost
Recording frost will be based on a percent coverage.Daily Snow
This procedure will work the same as daily rain except that snow accumulations will be entered. In addition, a separate form will be provided for daily snow. Users can enter visibility observations during the snowfall, current snow depth, and depth of snow drifts. In addition, observers will take a defined amount of snow and melt it down to water. This resultant water volume will provide an indication of liquid to snow equivalent, which also can be entered on the form.Snowflake Shape
When snow is measured from the gauge, observers will take a sample of snow and examine its shape (see Training Manual for more details). The web form will provide an option of many different snowflake shapes, and the user will choose the shape that the snowflake most closely resembles.Optical Effects
The time and date should be recorded anytime a corona, rainbow, halo or sundog is observed. Any additional notes are welcomed.Reporting of Data
Data reports will be available on the website. The user will have flexibility over which data to display and how they want it sorted. Reports will include:Daily Snow and Rain Reports
Provides the daily total of rain/snow accumulation. The amounts will be sorted by reporting station. Intense precipitation reports will also be included in this report.
Station summary snow and rain reports
Provides the rain/snow total at each station for a given period. The period will be specified by the user with a start and end date.
Number of Thunder Claps Report
Provides the daily total of thunderclaps heard, sorted by station. The user will confine the search to specific times and stations, which will list the time each clap was heard during the day.
Snow Shape Report
A method for putting this into a visual format has not yet been determined.
Optical Effects Report
Provides the daily total of optical effects sorted by station. The user can confine the search to specific times and stations, which will list the time each optical effect was seen during the day.
Software
The PA Climate Office has paired with CoCoRaHS in Colorado for data collection. The staff at Colorado State is creating a database to store PA data, and allow for transfer to the Climate Office and NWS offices. Colorado State utilizes a system that uses Microsoft's SQL server for a database and ASP.net (written in C#) for the front-end web application. The maps will be composed with ArcIMS. Because they have received funding from the NSF for this system, Colorado State has said we are welcome to make use of their software. In addition, Colorado State encourages us to use their system because they have an ultimate goal of all states using the same system. In this way, different states could customize the main system specific to their state. This would save each state the effort of building their system from scratch.


|
To organize a group training session e-mail us at psc@meteo.psu.edu
