Tornadoes
![]()
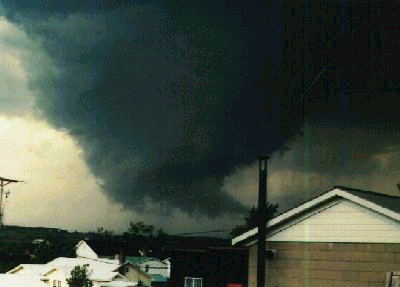
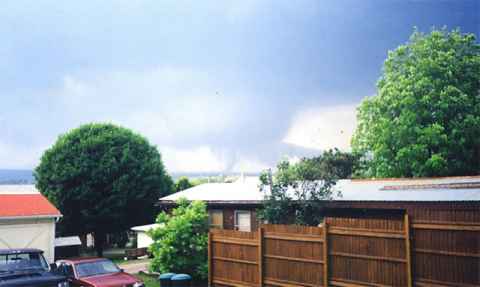
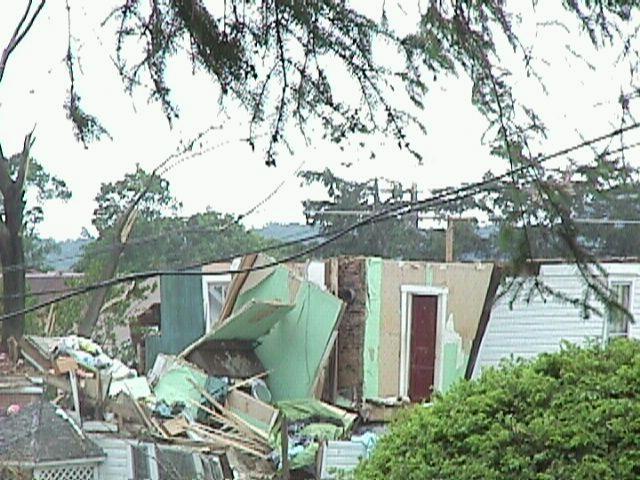
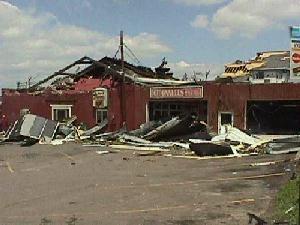
(Images: Salisbury, PA Tornado May 31, 1998)
Tornadoes
![]()


(Images: Salisbury, PA Tornado May 31, 1998)
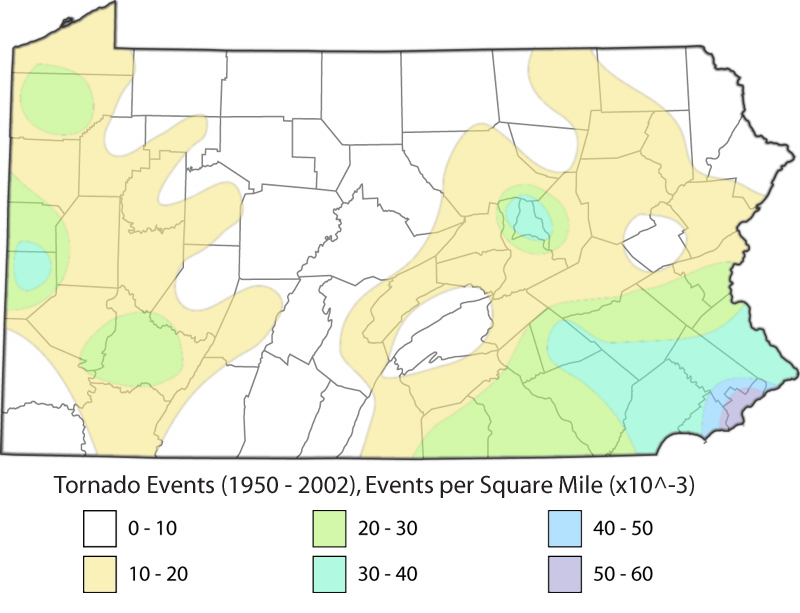
The following is a map of Pennsylvania with each county outlined. This map is a visual representation of the number of tornadoes per square mile x 10 ^-3. Along the bottom of the map there is a legend that describes what value each color represents, each color is an increment of 10. From this map we can see that the southeast and western portions of the state experience the greatest number of tornado occurrences per square mile.
The first table is a tabulation of the number of tornadoes that were recorded for each county during the 1950-2000 time period. This data was acquired through The National Climactic Data Center which provides tallied weather events per county ranging from tornadoes, lightning, hail, floods, wind, and the like.
Table 1: A representation of the number of recorded tornadoes per county
| County | # of Tornadoes |
| Adams | 13 |
| Allegheny | 13 |
| Armstrong | 8 |
| Beaver | 14 |
| Bedford | 7 |
| Berks | 19 |
| Blair | 3 |
| Bradford | 12 |
| Bucks | 19 |
| Butler | 14 |
| Cambria | 17 |
| Cameron | 3 |
| Carbon | 2 |
| Centre | 9 |
| Chester | 27 |
| Clarion | 6 |
| Clearfield | 8 |
| Clinton | 7 |
| Columbia | 5 |
| Crawford | 24 |
| Cumberland | 8 |
| Dauphin | 10 |
| Delaware | 6 |
| Elk | 5 |
| Erie | 15 |
| Fayette | 9 |
| Forest | 6 |
| Franklin | 8 |
| Fulton | 1 |
| Greene | 5 |
| Huntington | 9 |
| Indiana | 6 |
| Jefferson | 11 |
| Juniata | 1 |
| Lackawanna | 5 |
| Lancaster | 25 |
| Lawrence | 9 |
| Lebanon | 12 |
| Lehigh | 10 |
| Luzerne | 14 |
| Lycoming | 19 |
| McKean | 4 |
| Mercer | 12 |
| Mifflin | 4 |
| Monroe | 11 |
| Montgomery | 15 |
| Montour | 4 |
| Northampton | 11 |
| Northumberland | 8 |
| Perry | 3 |
| Philadelphia | 7 |
| Pike | 4 |
| Potter | 6 |
| Schuylkill | 12 |
| Snyder | 6 |
| Somerset | 10 |
| Sullivan | 9 |
| Susquehanna | 4 |
| Tioga | 3 |
| Union | 4 |
| Venango | 7 |
| Warren | 8 |
| Washington | 6 |
| Wayne | 2 |
| Westmoreland | 30 |
| Wyoming | 6 |
| York | 21 |
This first chart provides a visual interpretation of the distribution of tornadoes per county. The x-axis represents the individual counties, the y-axis is the number of tornadoes with intervals of 5.
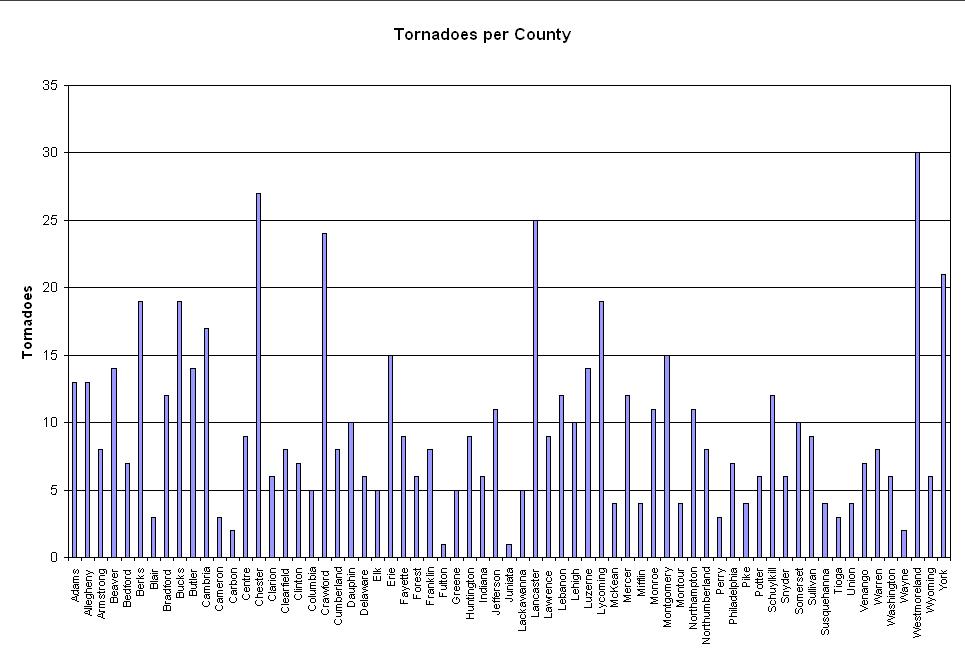
The following image provides another visual interpretation of the distribution of tornadoes per county from 1881 until June of 2003.

The second table is a representation of the Pennsylvania county populations and is included for reference for table 3 and its following chart. These populations are valid as of the 2001 Pennsylvania census.
Table 2: This table consists of the county populations
|
PA Counties |
County Populations |
|
Adams |
92,997 |
|
Allegheny |
1,270,612 |
|
Armstrong |
72,101 |
|
Beaver |
179,871 |
|
Bedford |
49,899 |
|
Berks |
377,679 |
|
Blair |
128,391 |
|
Bradford |
62,859 |
|
Bucks |
605,379 |
|
Butler |
176,593 |
|
Cambria |
150,726 |
|
Cameron |
5,866 |
|
Carbon |
59,506 |
|
Centre |
135,940 |
|
Chester |
443,346 |
|
Clarion |
41,478 |
|
Clearfield |
83,167 |
|
Clinton |
37,753 |
|
Columbia |
64,152 |
|
Crawford |
90,046 |
|
Cumberland |
215,695 |
|
Dauphin |
251,316 |
|
Delaware |
551,158 |
|
Elk |
34,666 |
|
Erie |
279,636 |
|
Fayette |
147,367 |
|
Forest |
4,910 |
|
Franklin |
130,506 |
|
Fulton |
14,314 |
|
Greene |
40,492 |
|
Huntingdon |
45,632 |
|
Indiana |
89,108 |
|
Jefferson |
45,712 |
|
Juniata |
22,877 |
|
Lackawanna |
211,829 |
|
Lancaster |
474,601 |
|
Lawrence |
94,160 |
|
Lebanon |
120,963 |
|
Lehigh |
314,204 |
|
Luzerne |
315,754 |
|
Lycoming |
118,977 |
|
McKean |
45,440 |
|
Mercer |
119,682 |
|
Mifflin |
46,554 |
|
Monroe |
144,676 |
|
Montgomery |
759,953 |
|
Montour |
18,281 |
|
Northampton |
269,779 |
|
Northumberland |
93,662 |
|
Perry |
43,787 |
|
Philadelphia |
1,491,812 |
|
Pike |
48,507 |
|
Potter |
18,154 |
|
Schuylkill |
149,176 |
|
Snyder |
37,720 |
|
Somerset |
79,553 |
|
Sullivan |
6,532 |
|
Susquehanna |
42,165 |
|
Tioga |
41,621 |
|
Union |
41,701 |
|
Venango |
57,098 |
|
Warren |
43,593 |
|
Washington |
203,737 |
|
Wayne |
48,392 |
|
Westmoreland |
368,983 |
|
Wyoming |
28,055 |
|
York |
386,299 |
The third table is the
number of tornadoes per person per county. These numbers were reached by
dividing the number of tornadoes for a particular county by that countyís
population. To keep the data uniform, five places after the decimal place
were used, which required rounding in some cases.
Table 3: This table is the number of tornadoes per person per county
|
County |
|
|
|
0.00014 |
|
Allegheny |
0.00001 |
|
Armstrong |
0.00011 |
|
Beaver |
0.00008 |
|
|
0.00014 |
|
Berks |
0.00005 |
|
Blair |
0.00002 |
|
|
0.00019 |
|
Bucks |
0.00003 |
|
|
0.00008 |
|
|
0.00011 |
|
Cameron |
0.00051 |
|
Carbon |
0.00003 |
|
Centre |
0.00007 |
|
|
0.00006 |
|
Clarion |
0.00014 |
|
|
0.00010 |
|
|
0.00019 |
|
|
0.00008 |
|
Crawford |
0.00027 |
|
|
0.00004 |
|
Dauphin |
0.00004 |
|
|
0.00001 |
|
Elk |
0.00014 |
|
|
0.00005 |
|
Fayette |
0.00006 |
|
|
0.00122 |
|
|
0.00006 |
|
|
0.00007 |
|
Greene |
0.00012 |
|
|
0.00020 |
|
|
0.00007 |
|
|
0.00024 |
|
|
0.00004 |
|
|
0.00002 |
|
|
0.00005 |
|
|
0.00010 |
|
|
0.00010 |
|
Lehigh |
0.00003 |
|
Luzerne |
0.00004 |
|
Lycoming |
0.00016 |
|
McKean |
0.00009 |
|
Mercer |
0.00010 |
|
Mifflin |
0.00009 |
|
|
0.00008 |
|
|
0.00002 |
|
Montour |
0.00022 |
|
|
0.00004 |
|
Northumberland |
0.00009 |
|
Perry |
0.00007 |
|
|
0.00000 |
|
Pike |
0.00008 |
|
Potter |
0.00033 |
|
|
0.00008 |
|
Snyder |
0.00016 |
|
|
0.00013 |
|
Sullivan |
0.00138 |
|
Susquehanna |
0.00009 |
|
Tioga |
0.00007 |
|
|
0.00010 |
|
Venango |
0.00012 |
|
|
0.00018 |
|
|
0.00003 |
|
|
0.00004 |
|
Westmoreland |
0.00008 |
|
|
0.00021 |
|
|
0.00005 |
The second chart provides a visual interpretation of the distribution of tornadoes per person per county. The x-axis represents the individual counties, the y-axis is the tornadoes events per person per county with intervals of 0.0002.
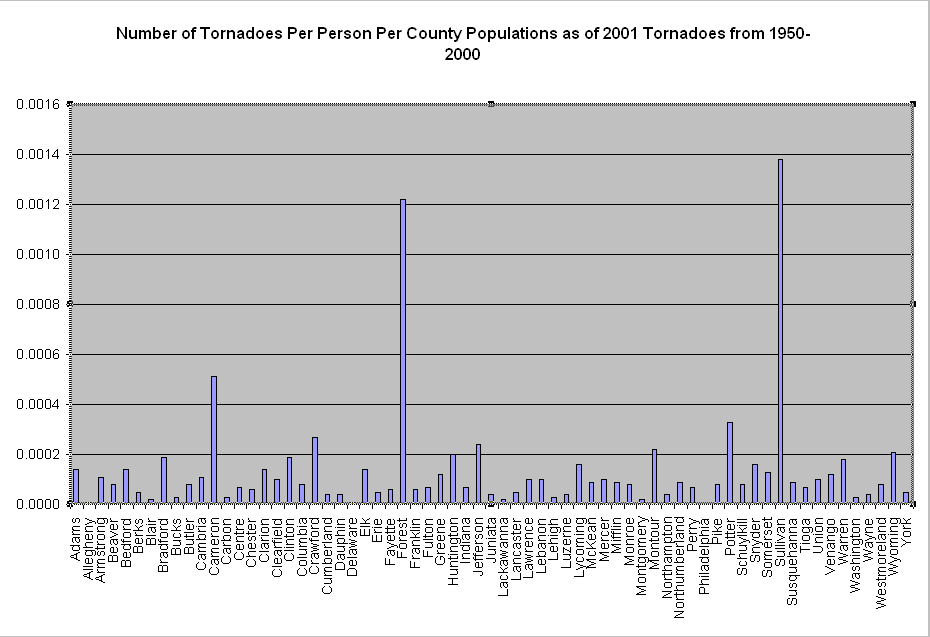
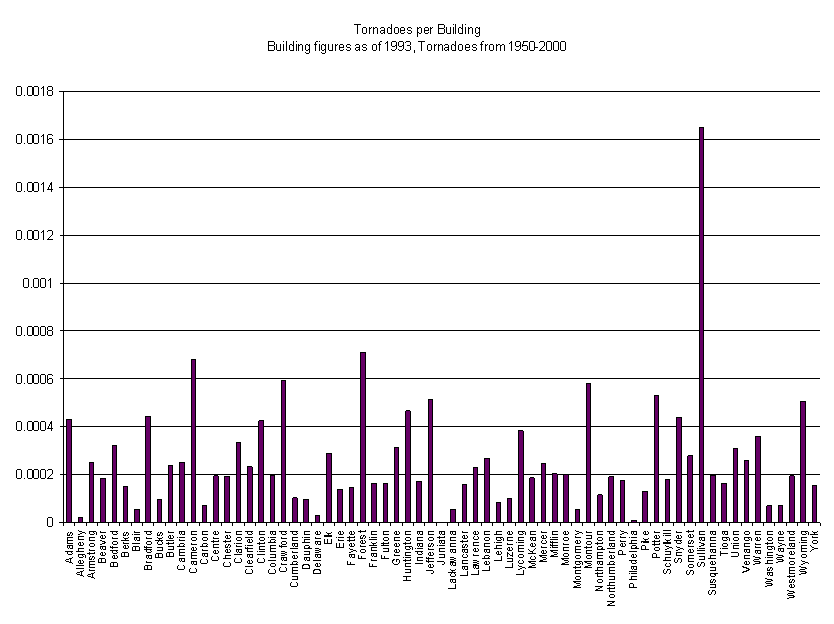
The third chart provides a visual interpretation of the distribution of tornadoes per building per county. The x-axis represents the individual counties, the y-axis is the tornadoes events per person per county with intervals of 0.0002.
The fourth table
is a representation of the time of year that is most prone to tornadoes. This
table was made by analyzing the dates of the recorded tornadoes and tallying
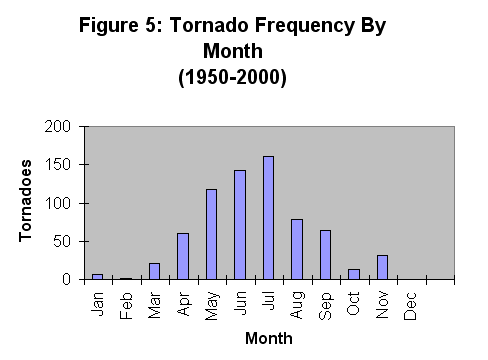
them. The month of July has the highest number of tornadoes with 161,
though May and June have only a few less. This
can be confirmed by the fact that these months fall within the time of year
where
Table 4: This table represents the time of year which is
most prone to tornado occurrence in
Months of Tornadoes |
|
|
January |
6 |
|
February |
1 |
|
March |
21 |
|
April |
60 |
|
May |
117 |
|
June |
143 |
|
July |
161 |
|
August |
78 |
|
September |
64 |
|
October |
13 |
|
November |
31 |
|
December |
0 |
The fourth chart provides a visual interpretation of the time of year
which is most prone to tornado occurrence in
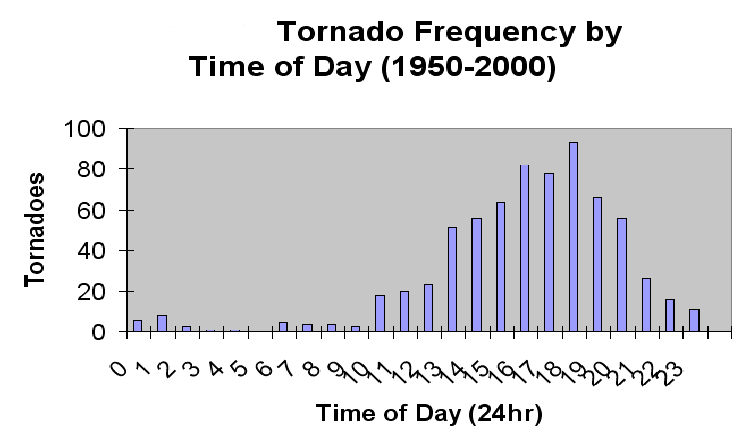
The fifth table is a representation of the time of day that is most prone to tornadoes. Differentiation between the times of day, regarding morning, afternoon, and night, were based upon the publicís general understanding of these time brackets. Times are in 24 hours and the times of occurrence are rounded to the hour. Each tornado event is listed below in the table by the time of their occurrence.
|
PA
Tornado Frequency by the Hour |
|
|
0: |
6 |
|
|
8 |
|
|
3 |
|
|
1 |
|
|
1 |
|
|
0 |
|
|
5 |
|
|
4 |
|
|
4 |
|
|
3 |
|
|
18 |
|
|
20 |
|
|
23 |
|
|
51 |
|
|
56 |
|
|
64 |
|
|
82 |
|
|
78 |
|
|
93 |
|
|
66 |
|
|
56 |
|
|
26 |
|
|
16 |
|
|
11 |
The sixth table is documenting the time of day that witnesses the most tornadoes. Due to gaps in the available data, not all time periods were accurately accounted for. To compensate, the day was broken down into hour intervals and the number of tornado occurrences that fell within each hour time period was recorded. This table is based upon data provided in Table 5. Within this table, the day is broken down into early morning, morning, afternoon and evening time periods; these times were based upon the general classification of times within the general public. The time of day that has had the highest number of tornadoes is afternoon, with 276 tornadoes.
Table 6: This table represents the time of day that that witnesses the most tornadoes
|
Tornado
Frequency by Time of Day |
|
|
Early
Morning (0: |
24 |
|
Morning
( |
49 |
|
Afternoon
(12:00:0- |
276 |
|
Evening
( |
170 |
|
Late
Evening ( |
53 |
The fifth chart provides a visual interpretation of the time of day that that
witnesses the most tornadoes in
